
Air pollution is not a uniform phenomenon: have you ever thought that it can vary drastically within the same city, creating disparities in the quality of the air we breathe?
European capitals, for example, are a reflection of this reality. Here the concentration of pollutants such as PM2.5, NO2 and ozone differ significantly between neighbourhoods, directly impacting public health.
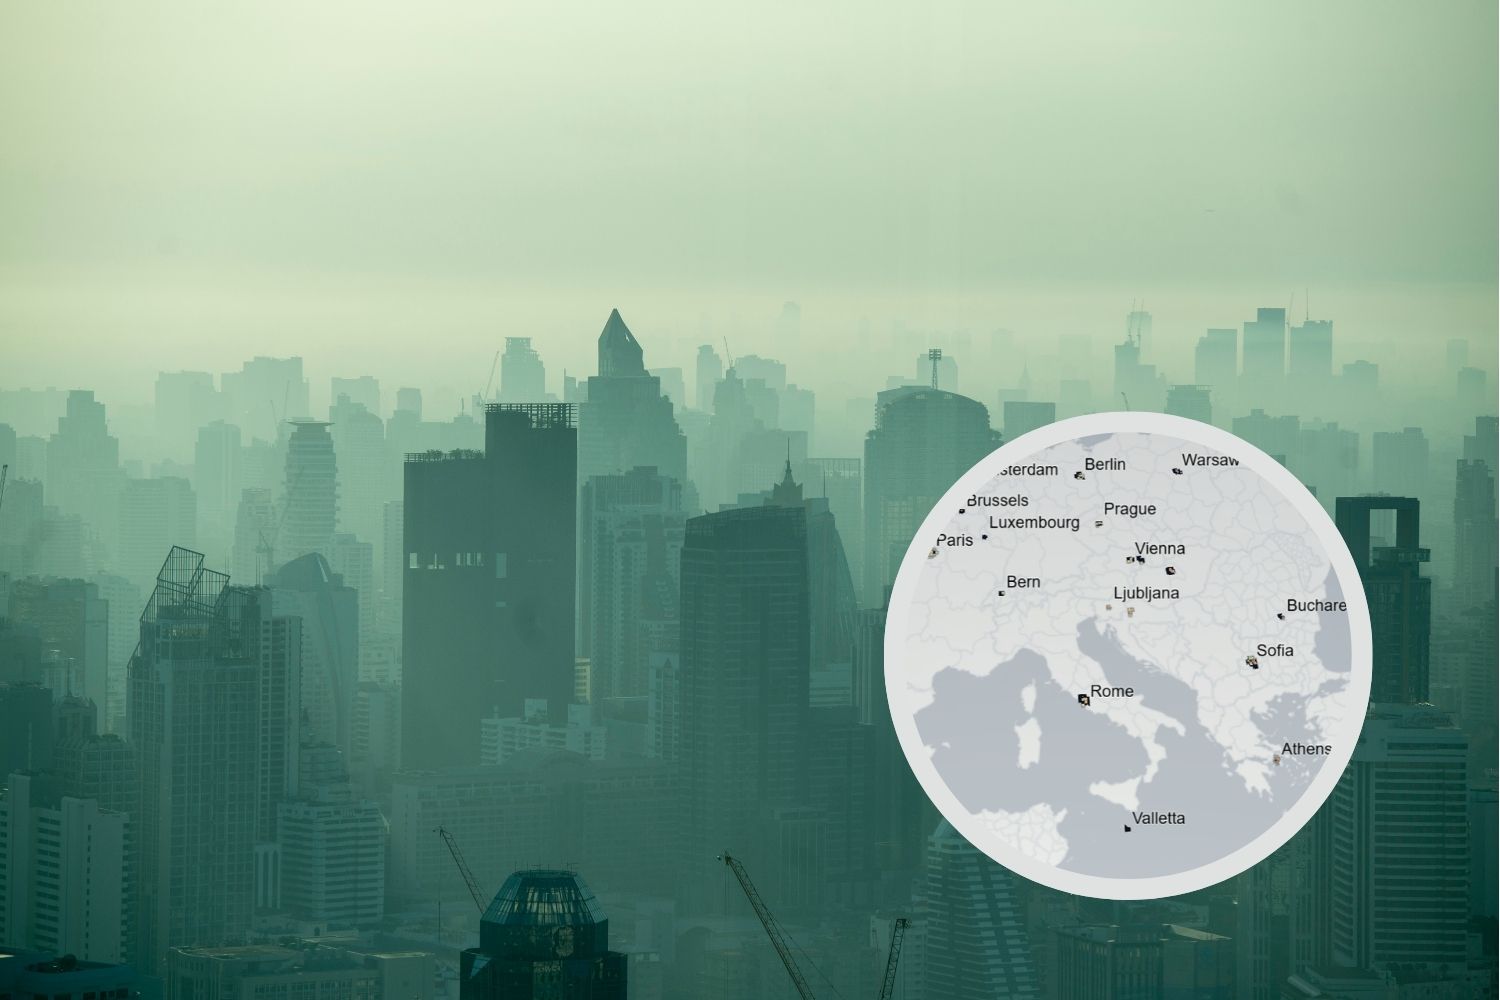
The European Environment Agency (EEA) has just developed an interactive tool to raise awareness of the impact of environmental inequalities: a 3D “viewer” that offers a detailed, high-resolution analysis of air pollutant concentrations in metropolitan areas of EU-27 capitals. A tool that is part of the Environment and Health Atlas, a project that highlights spatial inequalities in the field of air quality and urban healthiness.
The new 3D viewer
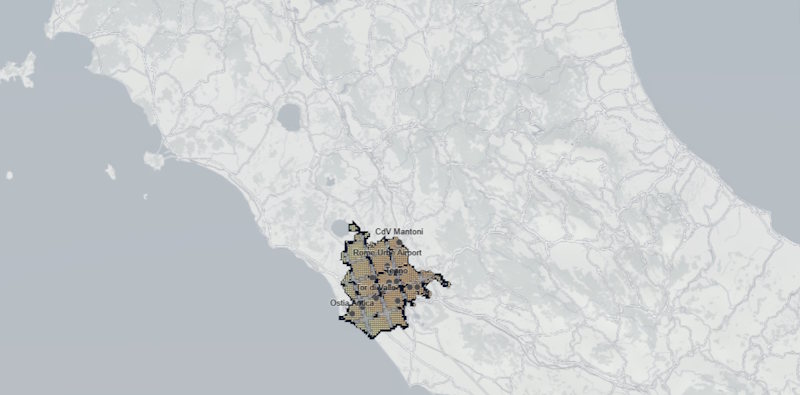
The interactive provided by the EEA allows you to explore annual average levels of key air pollutants — fine particulate matter (PM2.5), nitrogen oxides (NO2) and ozone — in European Union capitals, visualized at a spatial resolution of 1 × 1 km. This high resolution is crucial for spotting and understanding differences within cities, as pollution levels are not evenly distributed. Sometimes, just a few kilometers are enough to go from areas with relatively clean air to highly polluted ones.
The viewer allows:
This detailed visualization not only makes the differences in pollution visible between neighborhoods in the same city, but also offers a fundamental starting point for thinking about environmental equity. The concentration of pollutants is not random: often, the most exposed areas are those that host the most vulnerable social groups, contributing to perpetuating health inequalities.
The impacts of air pollution on health are well documented: from respiratory to cardiovascular diseases, up to a greater incidence of neurological diseases and cancer. However, not everyone is equally exposed to these risks. People living in more polluted areas, often peripheral or with less access to sustainable mobility infrastructure, are more vulnerable to the harmful effects of contaminated air.
The EEA highlights how these inequalities are a crucial issue not only for the quality of life of citizens, but also for social equity. Poorer neighborhoods, those with a higher population density, and more industrialized areas tend to have much higher levels of pollution than residential and green neighborhoods of the same cities.
So why not see this EEA tool as a call to action? Cities must take note of environmental and health disparities, adopting policies that can reduce pollution, improve access to green areas and promote more sustainable mobility. The availability of data at the neighborhood level makes targeted and timely action possible, which not only protects the environment, but also the health of citizens. Why not do it?