
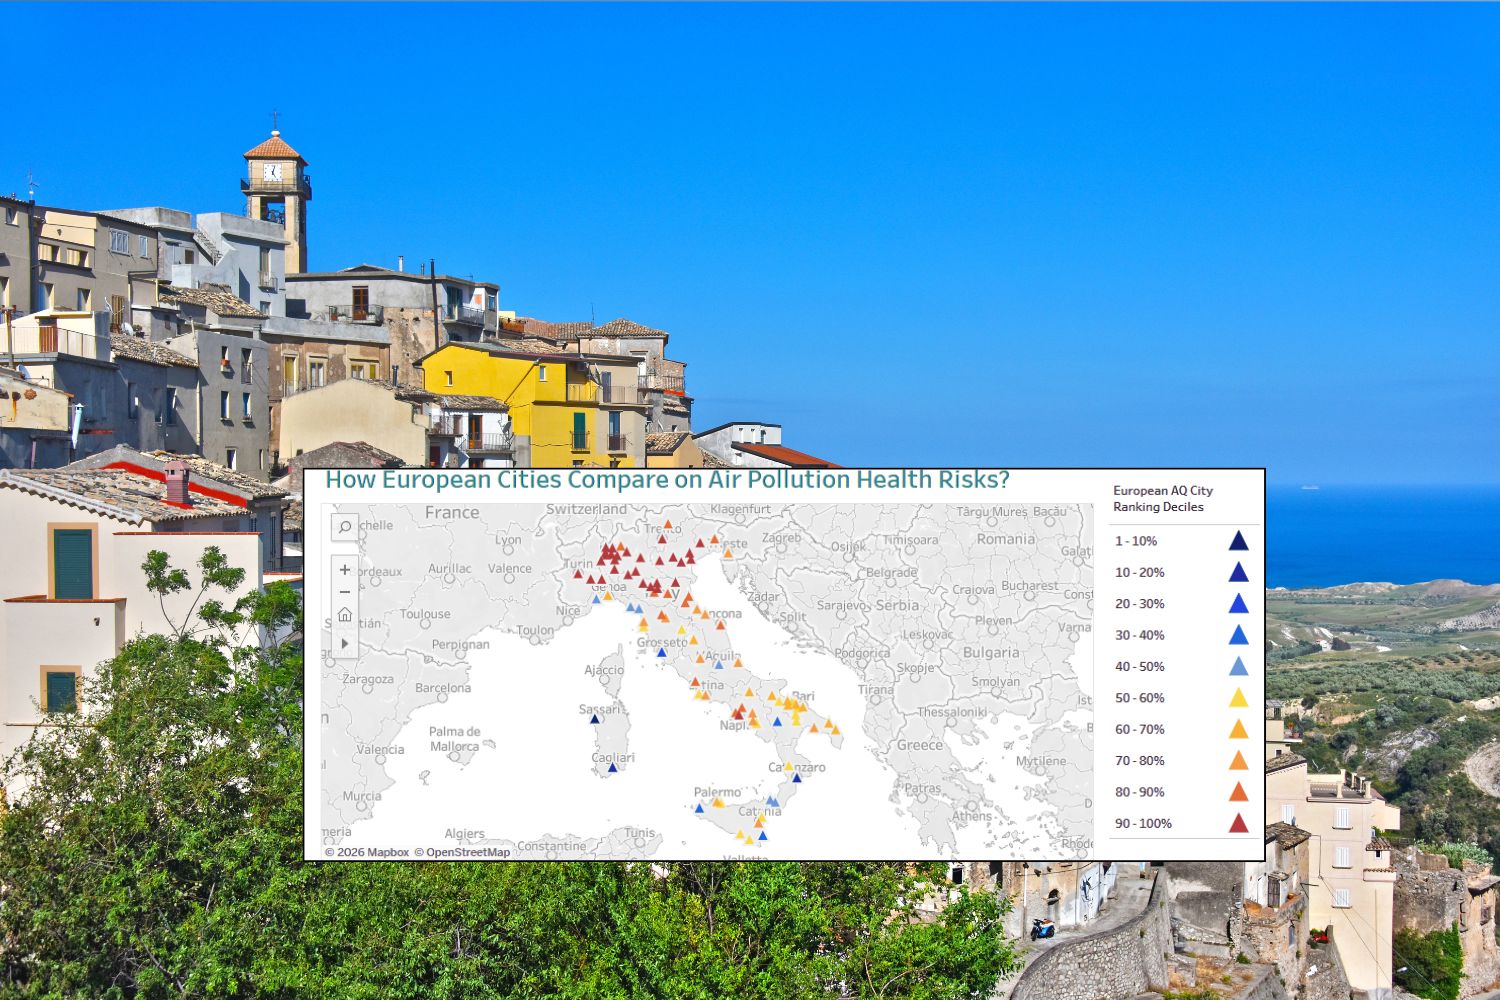
It is no longer enough to know how much fine dust we breathe. To really understand how healthy – and unhealthy – the air of a city is, we need to consider a set of pollutants and, above all, their impact on the health of those who live there.
This is the principle behind the new European ranking of air quality in cities, updated by the European Environment Agency (EEA), which compares 761 European urban centers on the basis of the mortality risk associated with prolonged exposure to three of the main air pollutants: PM2.5, nitrogen dioxide (NO2) and ground-level ozone (O3).
A much broader picture than in the past, which confirms a fact that is now difficult to ignore: despite the progress made over the last thirty years, air pollution continues to represent a health risk in most European cities.
Until 2025, the EEA ranking essentially took into consideration the average concentrations of PM2.5 recorded by urban and suburban monitoring stations. This allowed for the inclusion of approximately 372 cities and inevitably provided a partial vision of the problem. Now the methodology has changed and cities are ranked based on the combined mortality risk associated with long-term exposure to PM2.5, NO2 and ozone, considering data for the last two calendar years prior to publication.
The analysis also uses data modeled on maps with a resolution of 1×1 kilometre, so as to estimate population exposure even in cities where there are no detection stations for each individual pollutant.
In other words, the question is no longer just: “In which city are there the least fine particles?“, but: “Where does overall pollution exposure pose the lowest health risk?”
The ranking of cities
The 761 cities are placed in ten categories, corresponding to the same number of risk deciles. Category 1 includes the 10% of cities with the lowest total mortality risk (dark blue arrow), while category 10 includes the 10% with the highest values.
For each urban center it is possible to consult the overall positioning, the individual indicators relating to PM2.5, NO2 and ozone, the concentrations weighted by the population and demographic data.
Among the European capitals, in the 2026 update are:
@EEA
However, some cities in southern Europe have also shown significant improvements compared to previous updates. Among these, the EEA highlights Catanzaro, together with Zaragoza in Spain, Valongo in Portugal and Fiume in Croatia.
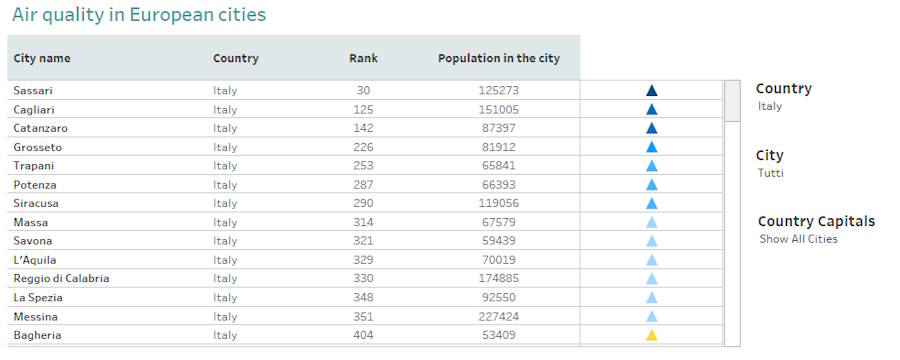
The best Italian cities
Before Catanzaro there are two Sardinian cities:
And to follow, with the best score:
@EEA
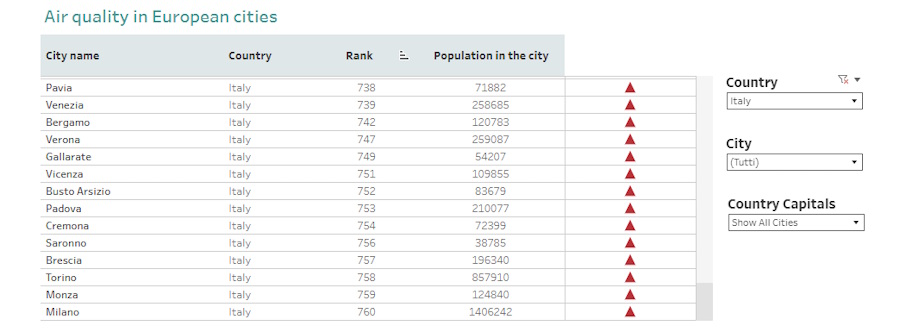
And the five worst
The last 5 Italian cities with the worst rank are:
@EEA
Because long-term exposure counts above all
The ranking looks at something deeper: the air we breathe day after day for years.
According to the WHO, it is precisely prolonged exposure to air pollution that produces the most serious health effects. This is why the EEA focuses its ranking on the risk linked to chronic exposure and not on the fluctuations of a single day. (European Environment Agency)
Alongside the ranking, the Agency has also created a trend viewer which allows you to observe how the concentrations of PM2.5, NO2 and ozone have changed in individual cities over time, using data officially communicated by European countries. The currently available series runs from 2013 to 2024. (European Environment Agency)
