
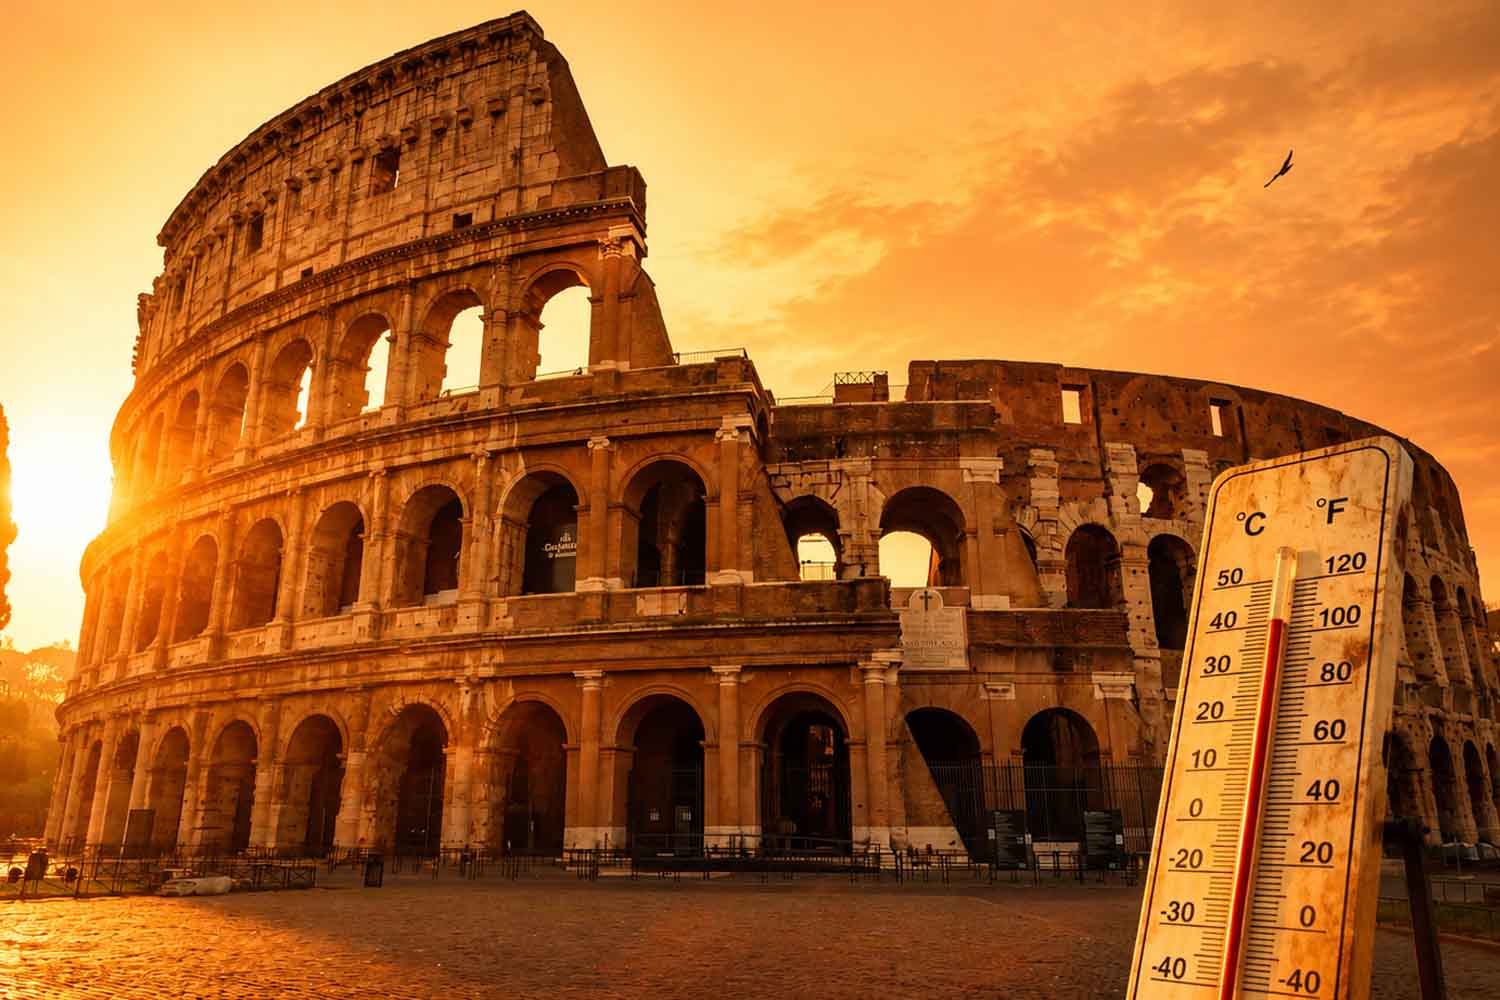
Rome knows the heat well, even too well. The cobblestones that seem to hold back the sun out of spite know it, the bus stops where the shade is a divine concession, the houses that in July become ovens with the rental contract. This time the bar phrase about “it’s hotter than it used to be” finds a precise hook: a historical series, a recognizable place, a thermometer planted in the heart of the city. And that thermometer says something quite brutal: from the 1980s to today the capital has warmed by around 3 degrees.
The data comes from a new Istat processing on the historical weather stations of four European capitals: Berlin Dahlem, Madrid El Retiro, Paris Montsouris and Rome Collegio Romano. The Roman curve, in the graph of average annual temperatures and five-year moving averages, rises with particular force in the last part of the series. Istat reports that in all four cities the maximum increase is concentrated in the last 15 years, but Rome is already starting with a heavier gap on its shoulders.
The center keeps track
The Roman College here functions like a long thermometer, planted inside a city that has changed its skin many times. The series runs until 2024/25 and brings together the climatic memory of over a century and a half. Inside that blue line, Rome shows an ancient stability and then an increasingly evident climb: the transition from the 1980s to today appears like a ramp, with the last stretch much steeper.
For a city already accustomed to living with long, harsh summers, the comparison weighs more than usual. Madrid, Paris and Berlin are growing, but Rome is growing more. About one degree higher than the other capitals considered. Read on the screen it doesn’t seem like much, but a degree inside a room without air, on a tropical night, with the fan moving only hot air, becomes another matter.
The nights are getting longer
Urban heating fits into an already very clear national framework. In the period 2006-2023, compared to the 1981-2010 climate average, among the 21 Italian regional capitals the summer days, i.e. those with maximum temperatures above 25 °C, went from 101 to 114. Tropical nights, with minimums above 20 °C, rose from 38 to 49. Translated into daily life: more hot days and more nights in which the body struggles to recover.
Rome, with the data of the Roman College, is right inside this transformation. More hot days, more heavy nights, more accumulated fatigue. Today’s hot city arises from a combination of factors: general warming, the weight of the urban environment, the effect of heat islands, which Istat indicates as an element capable of making the trend in city areas even more accentuated. The average temperature tells a trajectory; the tropical nights tell the story of the way in which that trajectory enters homes, in interrupted sleep, in fans left on.
Rome within a changing climate
2024 helps understand the scale of change. Compared to the period 1991-2020, ground temperatures were higher by +0.7 °C globally, +1.3 °C in Italy and +1.5 °C over Europe as a whole. Istat also recalls that 2022 and 2023 were the warmest years for Italy since the beginning of measurements.
Within this framework, the 3 degrees of the Roman College since the 1980s become a much harsher local signal than a global average. There are more hours of discomfort, air conditioners turned on for longer, more tired bodies, more exposed elderly people, harder neighborhoods to cross at the wrong hours. The average temperature seems like a clean figure. Then it comes down from the graph and rests on the people.
The Mediterranean also confirms the pressure. Between 1940 and 2025 the average annual temperature of the Tyrrhenian and Adriatic Seas increased by more than 1°C, double the speed of the global average. It is the context in which Rome operates: an internal capital, close to the Tyrrhenian Sea, within an area that Istat defines as particularly vulnerable from a climatic point of view.
The Tiber in the same story
The heat, in Rome, also affects the water. The analysis of the water outflows of the main Italian rivers has shown a tendency towards contraction in the Tiber basin, together with that of the Arno, since the 1980s. The Ripetta station appears in the Istat graph, therefore a Roman point par excellence, with a long series that tells the variations in the average annual flow rates compared to the 1926-1999 average.
The Po, explains Istat, benefits from the natural regulation of the pre-Alpine lakes, even if seasonal analyzes also show a strong increase in summer low water levels in the Po basin, culminating in the crisis of 2022. The Tiber, on the other hand, enters the picture with a fragility closer to Roman life: less water in the basin, hotter in the city, summers that look less and less like a parenthesis and more and more like a long condition.
Meanwhile, Italian greenhouse gas emissions have followed a different trend: peaking in 2005, then rapidly declining, to a level in 2024 almost 30% below that of 1990. This does not erase the temperature already accumulated in the cities. The Roman data, in fact, speaks of effects now visible in the historical series, with a curve that has already changed altitude. On the graph the Rome line rises. In normal life, the city lowers its shutters, looks for a tree, waits for evening. And he discovers that the evening is no longer enough.
You might also be interested in:
